Language mapping - a personal history
The start of a funny hobby
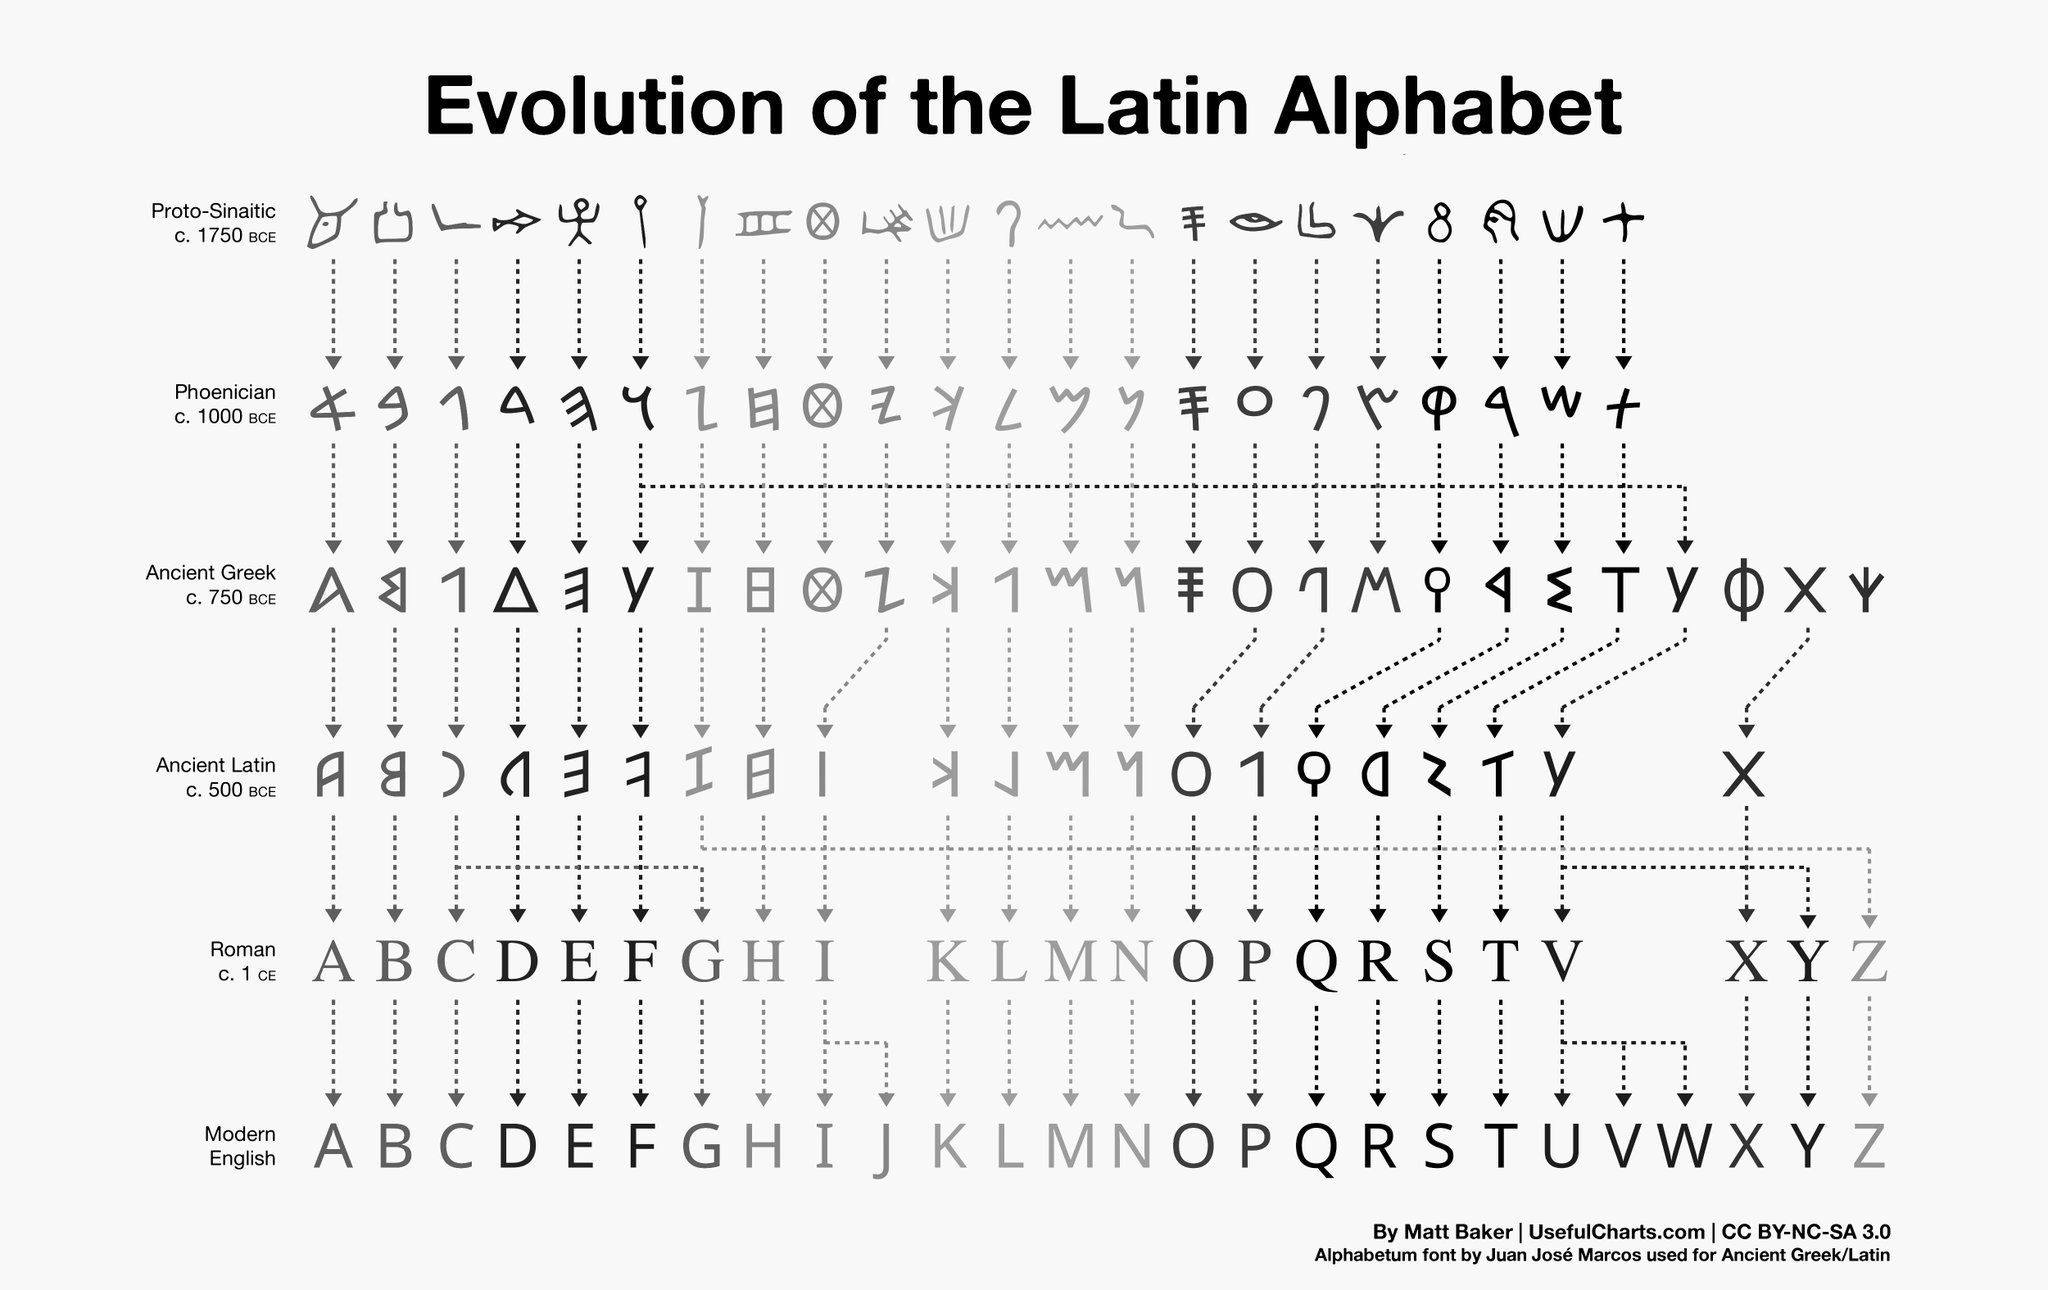
As a small kid I often snuck down in the morning in my pyjamas, to read encyclopedias and use my parents' old typewriter. I was mainly fascinated with maps, countries, flags and alphabets. We had a Winkler Prins 20-piece encyclopedia (a staple household item still in the late 80s), which showed the progression of alphabets from, if I remember correctly, Egyptian hieroglyphs via Phoenician to Greek and Latin alphabets. I was stunned to see this - centuries of pictorial evolution, spread out over the eastern Mediterranean coastal areas. I could just imagine how many tiny changes led to big changes when viewed over longer periods of time. This chart must've looked something like this:
From there I got into maps and languages (aided by Hans-Joachim Störig's book on languages) and geographic distribution of languages and dialects. I started collecting atlases (I now only have around 10 of them, because I got rid of many in the past including, regretfully, some really nice historic atlases) and information on countries and languages. At the age of 10 (best guess) I had quite a collection of the numbers 1 through 10 in many languages, which gave me the opportunity to do some comparative linguistics. I got the information mainly from books in our local library, which I first copied by hand and later photo-copied (using my weekly allowance). This also led to the first language maps, which I must've seen both in the encyclopedias and in library books.
My first language maps
In primary school I once gave a show and tell on my hobby: "cartography". My classmates must've been slightly confused. But yeah, I could draw maps quite well, and can still draw quite an accurate map of Europe with all country boundaries from memory. My first language maps were probably copies of maps I found in books, and I drew them in a notebook from school. Here are some that I scanned:
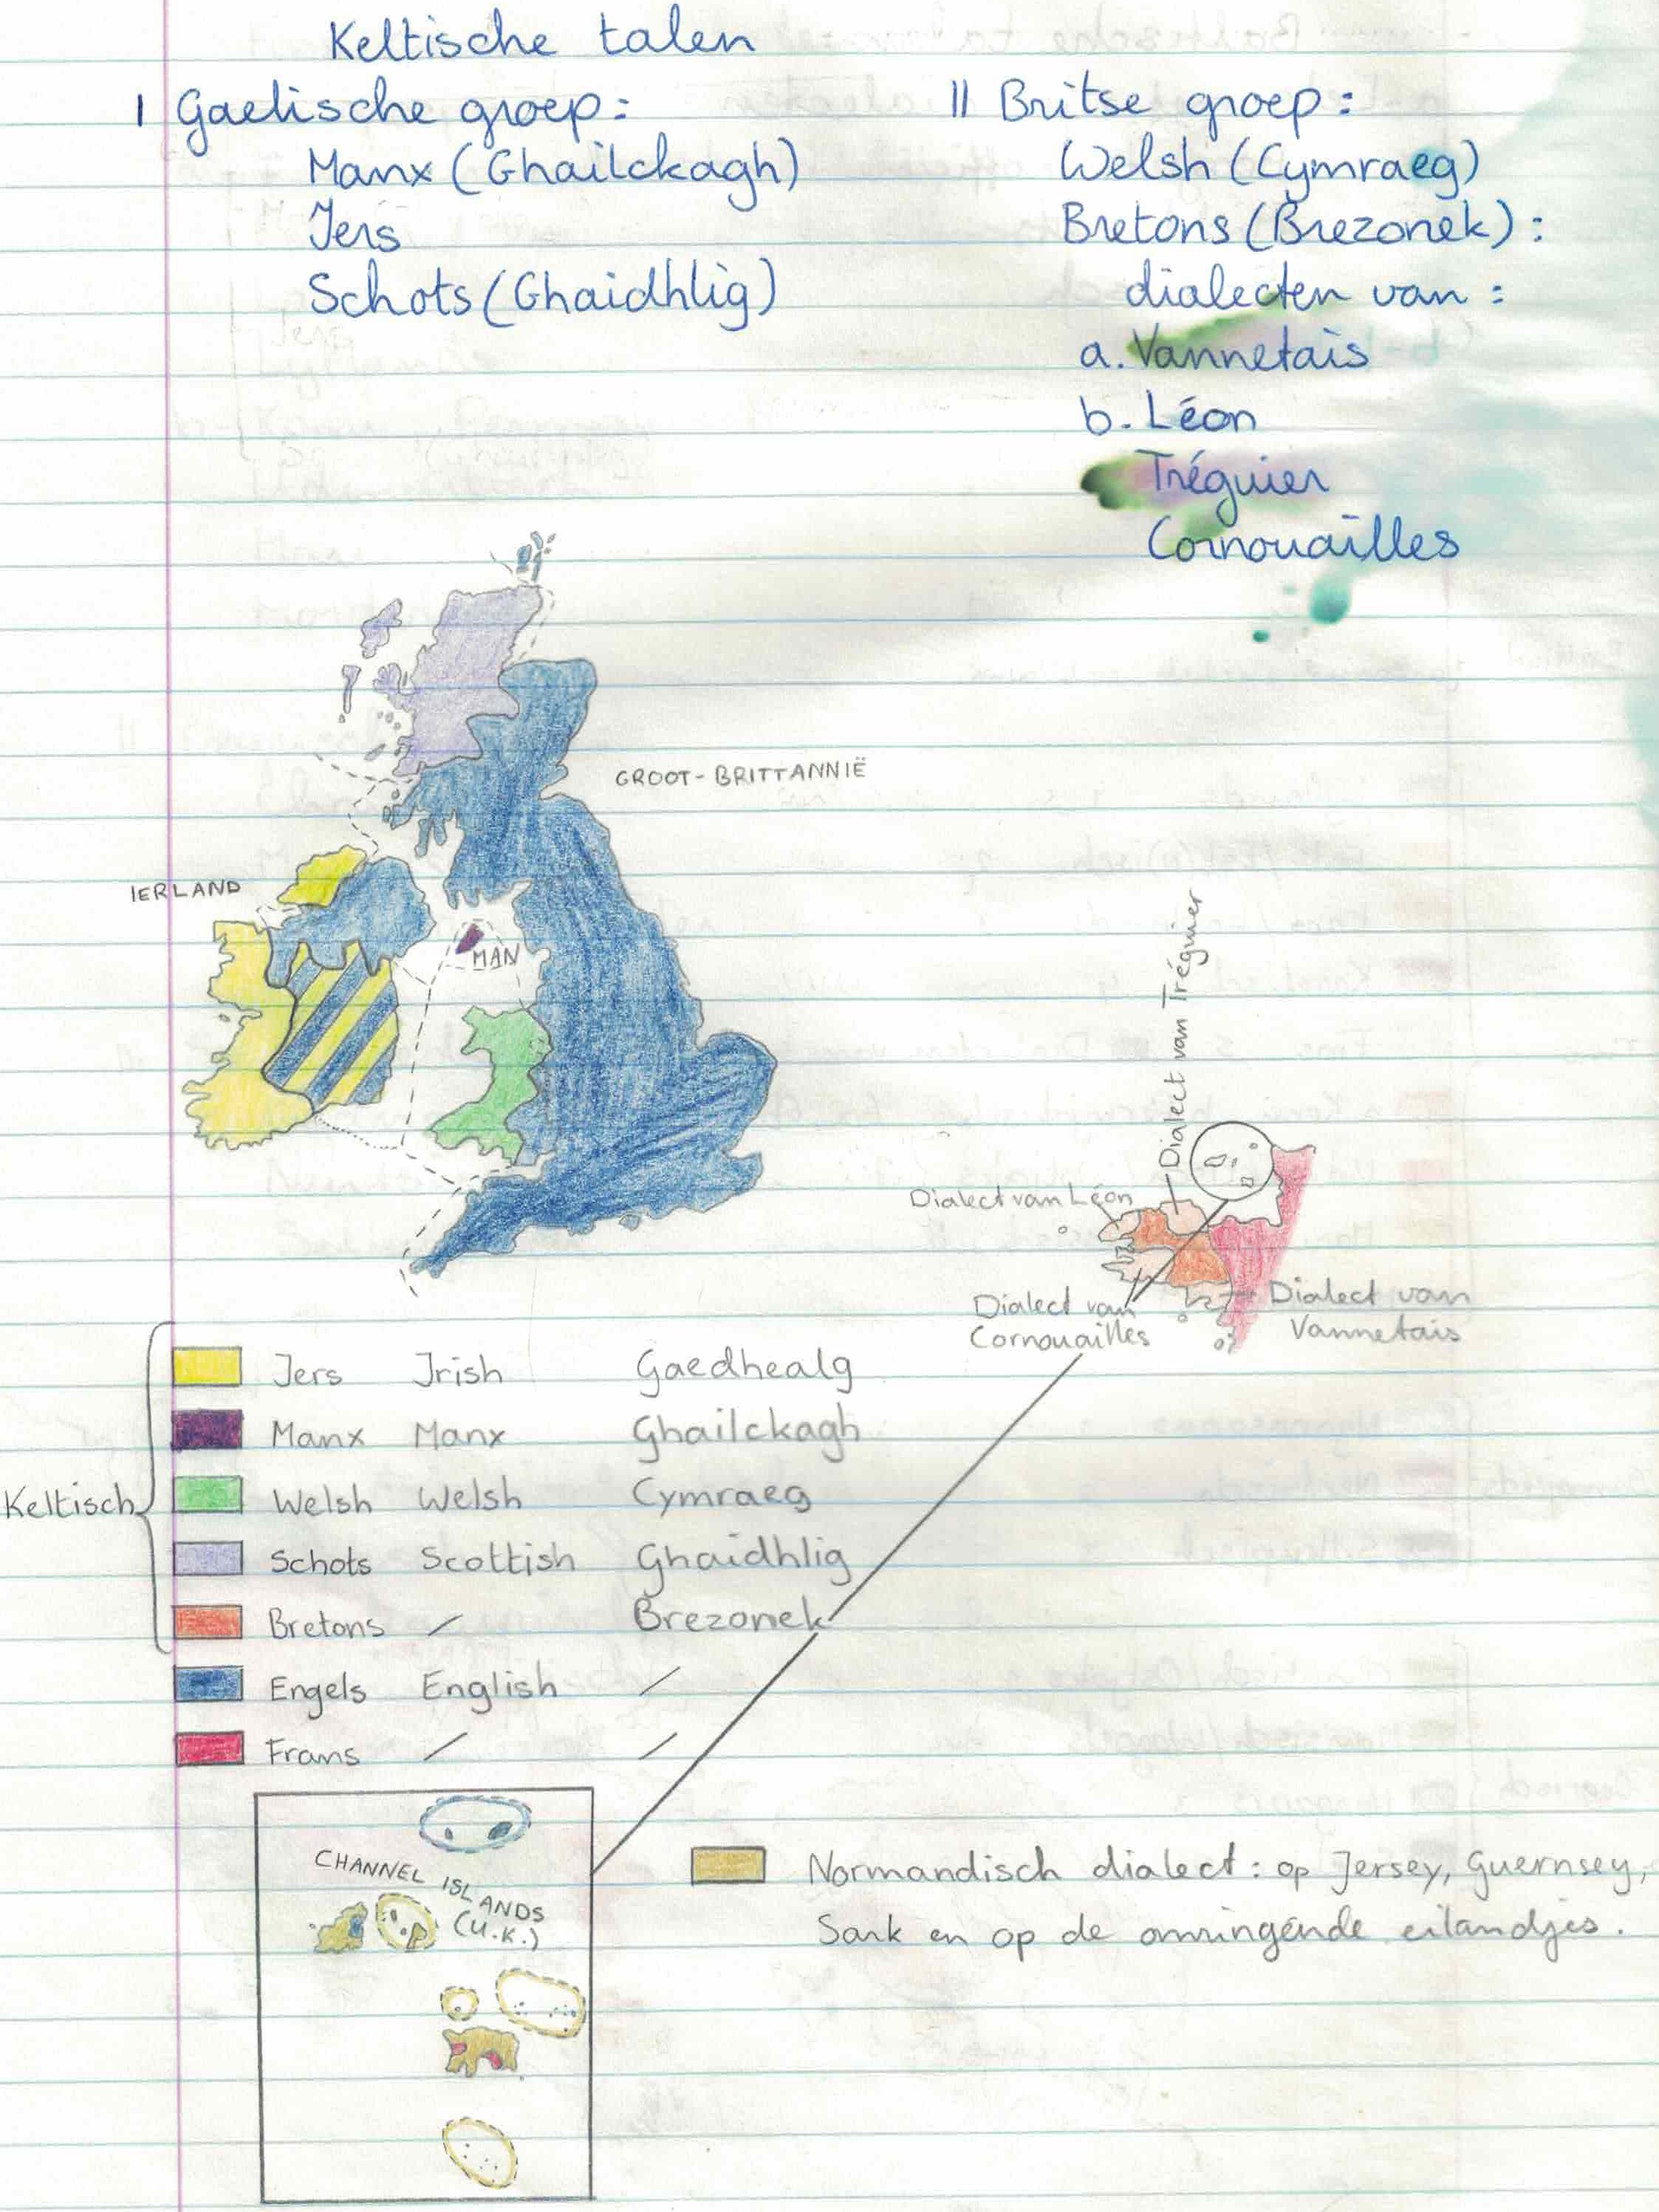
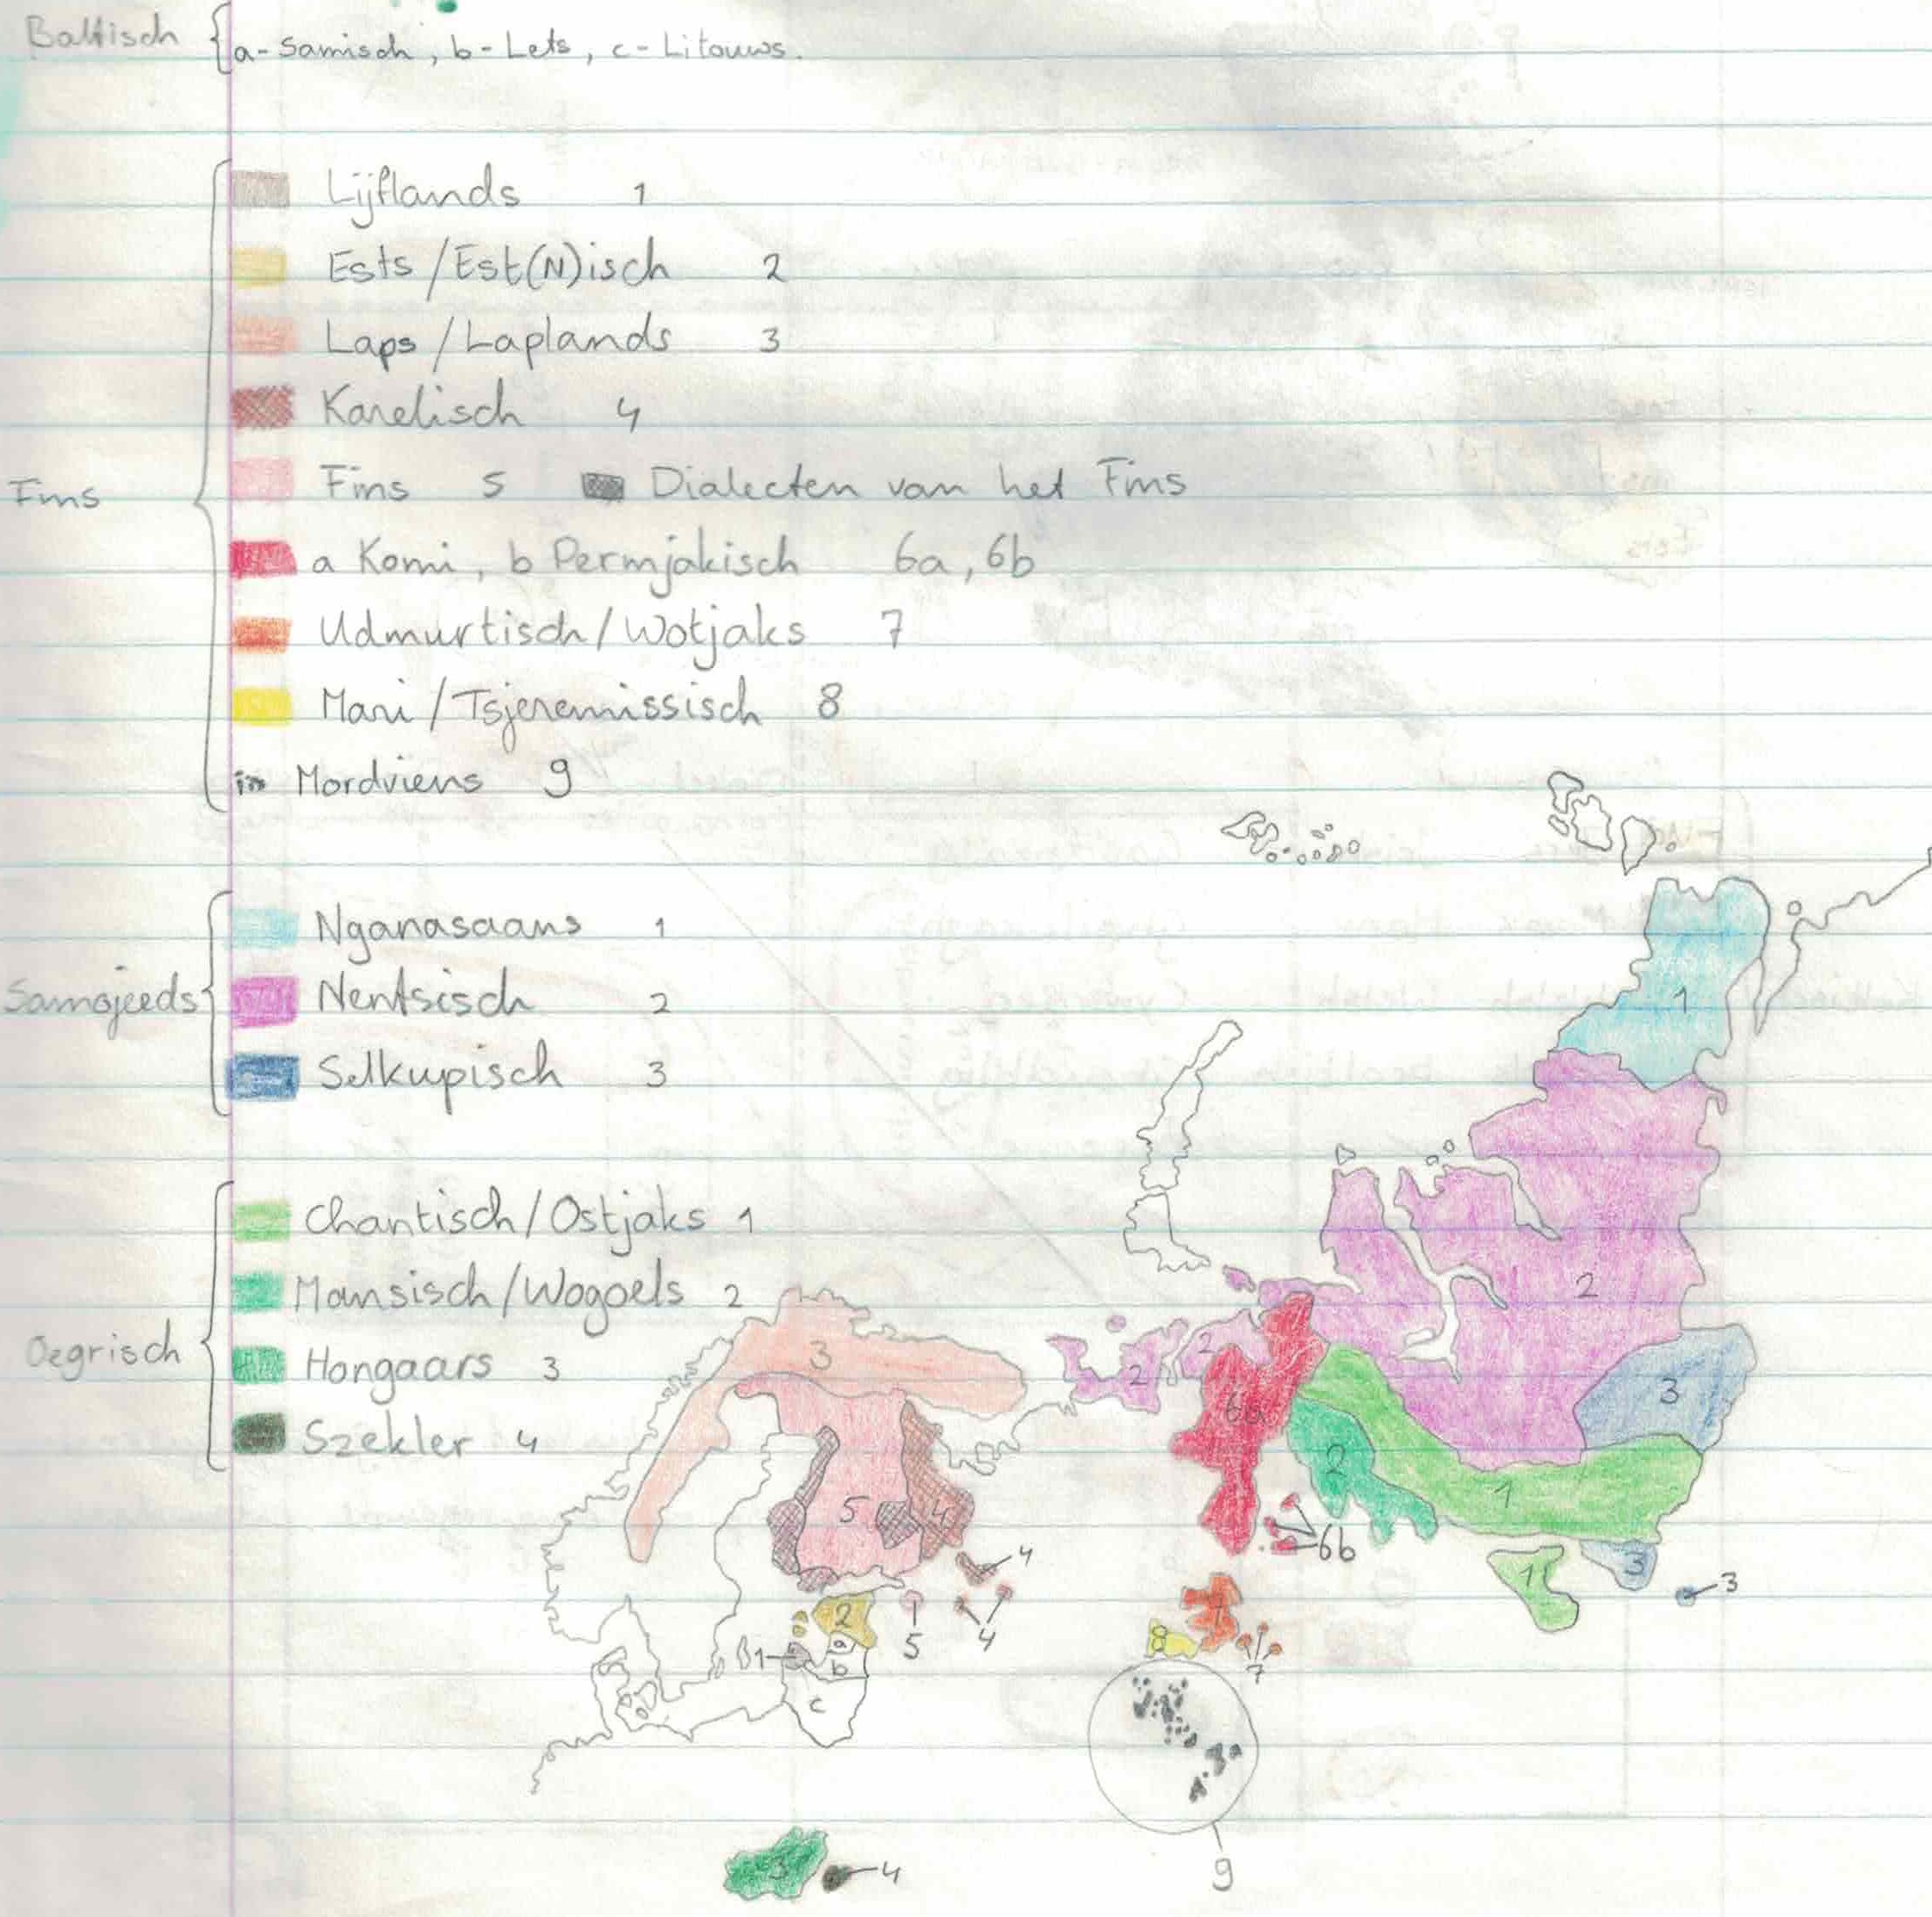
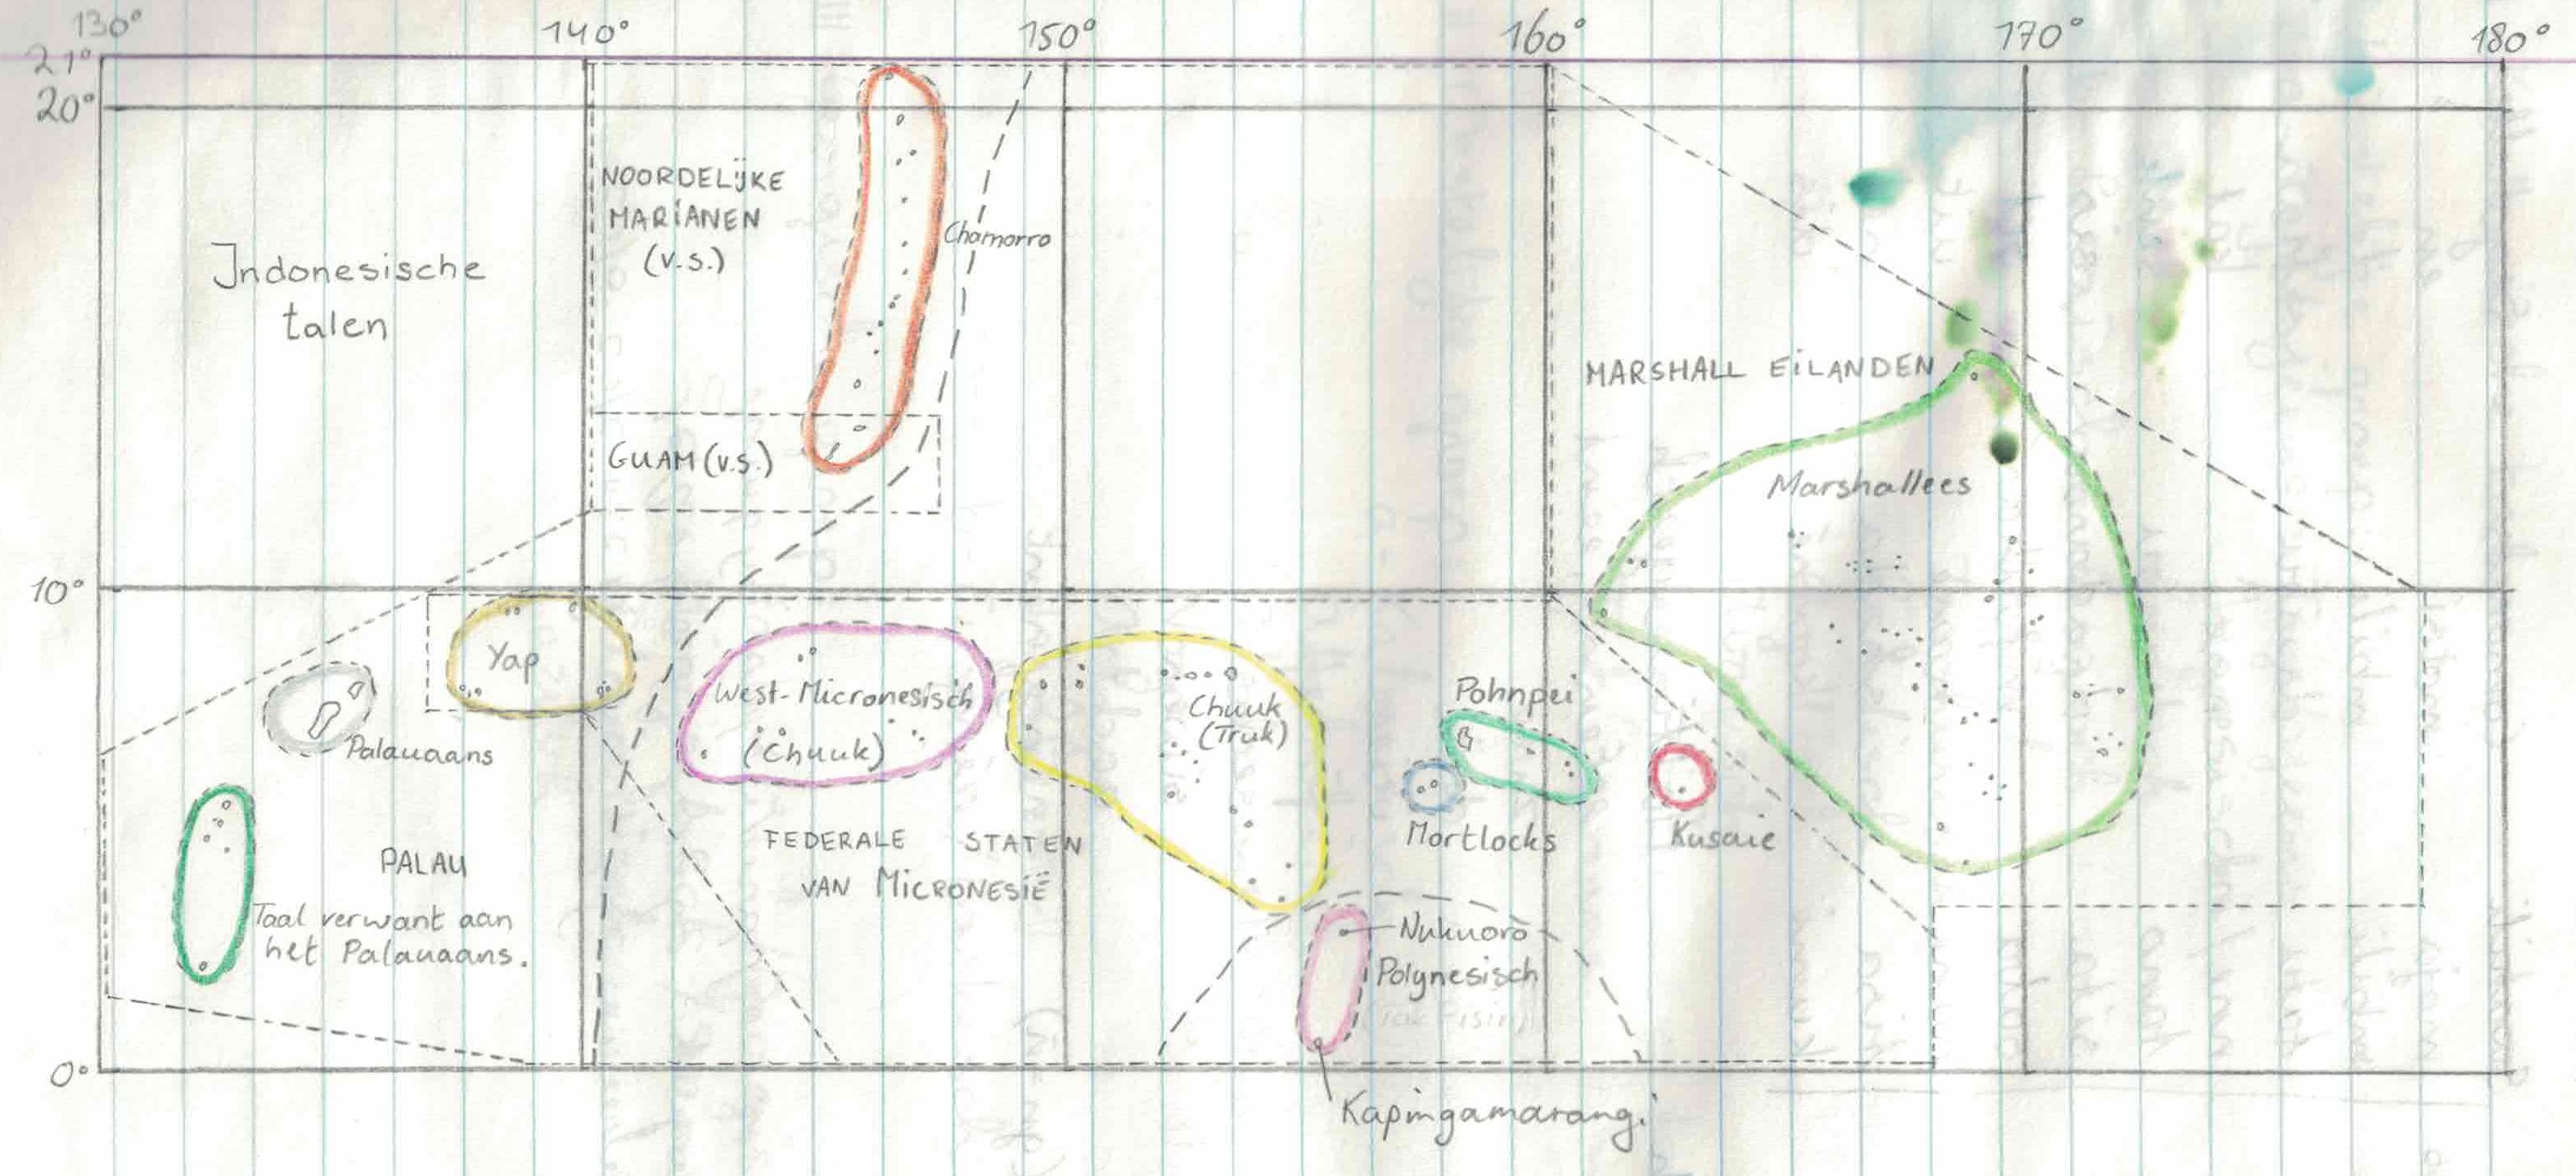
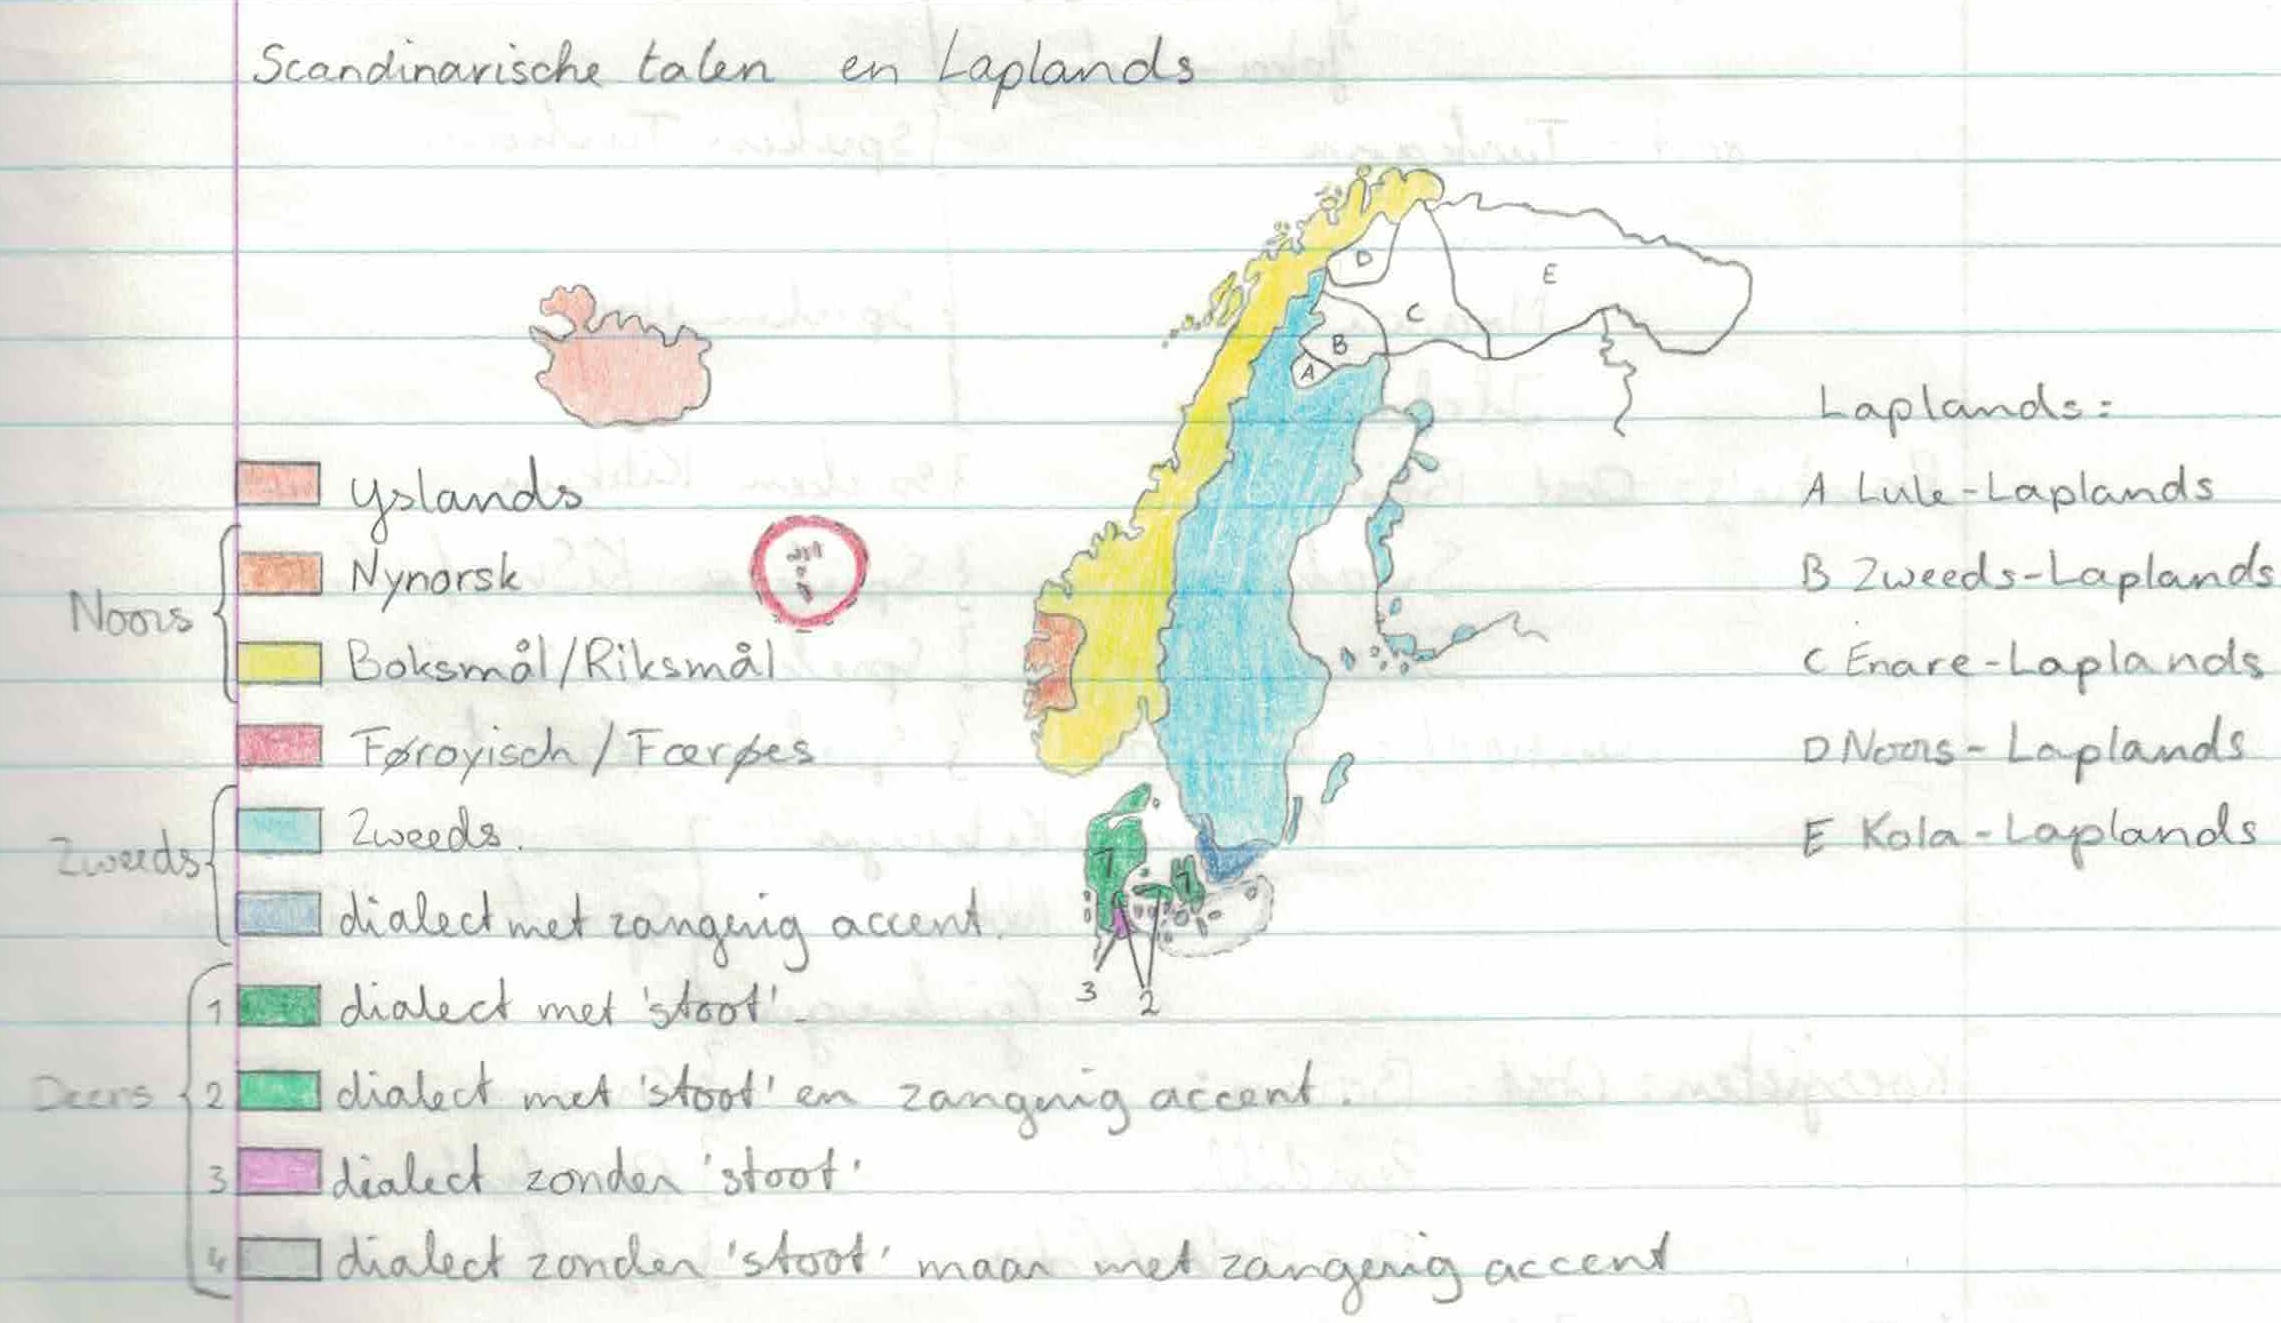
I still impress myself with these maps. Kids my age must have been playing soccer or chasing girls. Yet here I was, drawing maps and filling them in with colored pencils. Probably early in the morning, when everyone was sound asleep and the world was still mine. My best guess is, that these were probably also my last hand drawn maps. Other hobbies must have found prevalence, in rough chronological order through my teenage years: coins and stamps, Legos, electronics, weed.
Computer drawn language maps
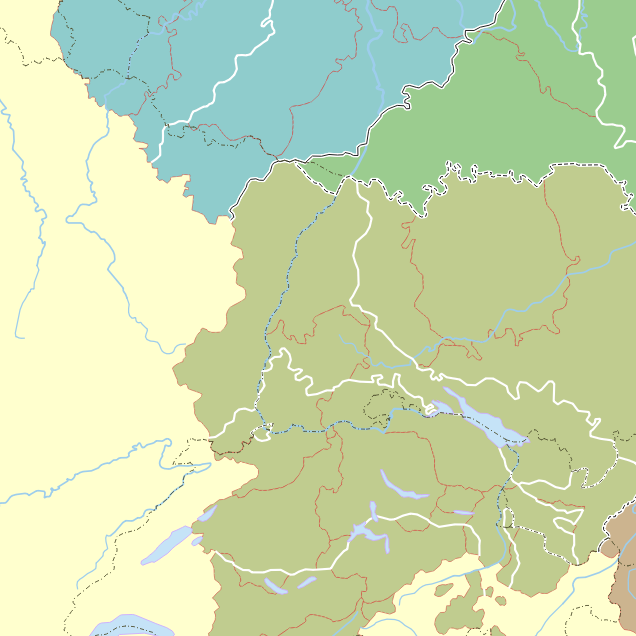
In my twenties I lived in Nijmegen and had very little to do. I had discovered computers in my late teens and was very comfortable using them. I knew how to use Illustrator and Inkscape, had a drawing tablet and only a very small social circle (I had fled my home town which had started to suffocate me, but now I was kinda on my own). I took up the hobby of drawing language maps again, but now with the aid of PC for drawing and the internet for information gathering. That was awesome! Suddenly I found a plethora of information online: language maps drawn by others and scientific articles about language and dialect distribution. I now had enough material and time to craft my first serious language map: the languages and dialects of Europe:
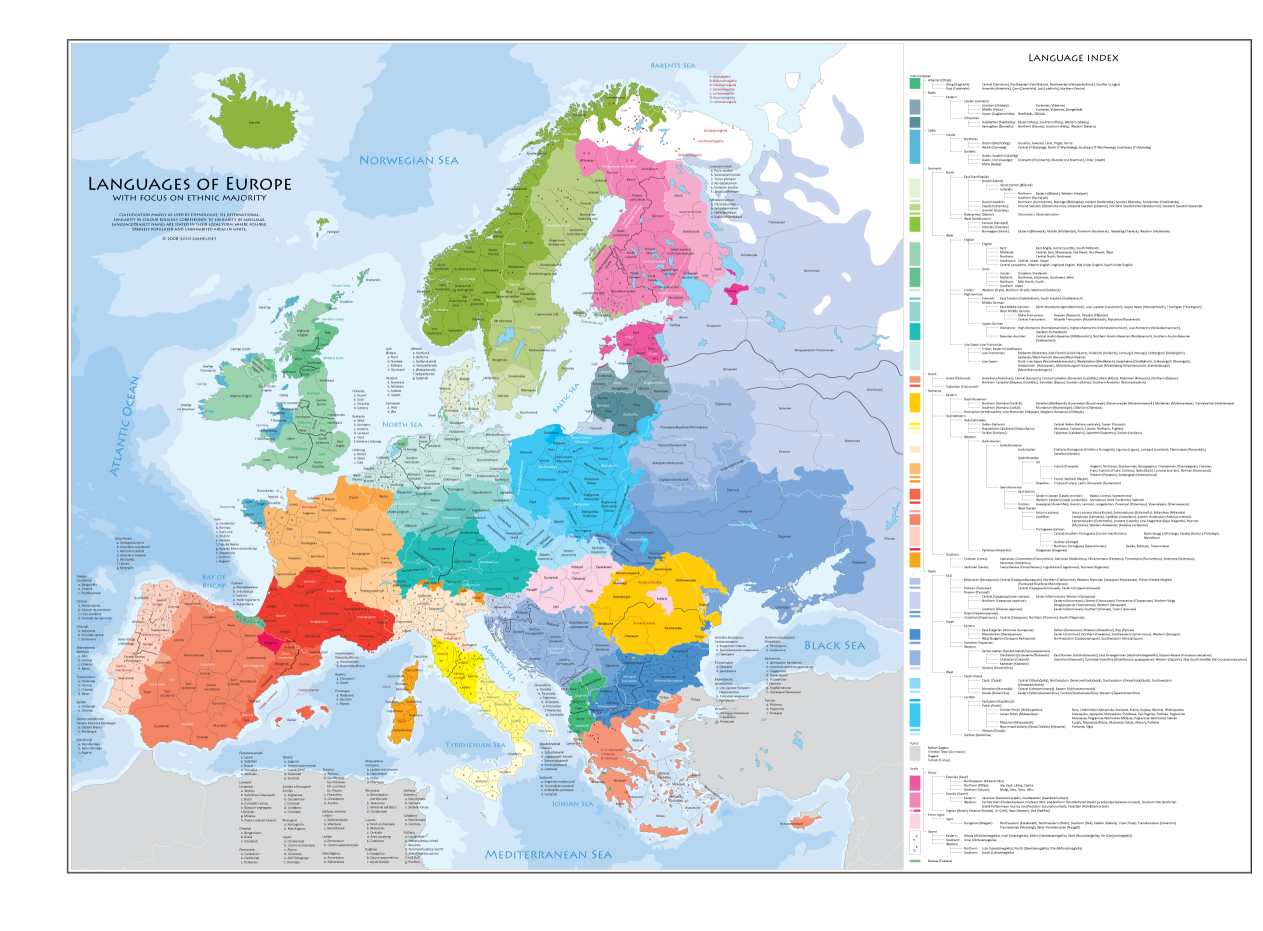
Since I had not yet found good sources of empty vector maps, I traced the full coastline by hand with a tablet from a high resolution map of Europe. That alone took me many evenings of work. I vividly remember tracing Crimea... what a work that was! When I was done with the coastlines and the political borders, I started filling in the language information. My workflow consisted of finding the most relevant language map of the area of interest (the Basque dialects for example), placing it on a background layer in Inkscape, rotating/scaling/skewing it until the political borders matched up, and then I would trace the language borders by hand using my tablet. What a work that was again. For each language area, I often spent multiple evenings on research, and then quite some time drawing. Matching up the two maps was a lot of work, and while going through this process I learned a lot about map projections! What I also found out, was how badly many maps are drawn - probably hand drawn from before the computer era. When it was finished, I printed some of these maps on A0 format, and my dad hung one on the wall for a while. A lot of research went into the map: the classification roughly follows Ethnologue (which is now behind a paywall) and the language and dialect borders are all traced from other maps or constructed from information I found in articles. Oftentimes I found conflicting information on classification and borders. For each cluster of dialects, I tried to gather as much information as possible, and construct the borders based on occurrence. Finding suitable color palettes was also a major challenge, and I find that aspect quite lacking in the maps I made. I am still sometimes looking for a way to generate color palettes for a map like this that looks good and gives the desired contrast.
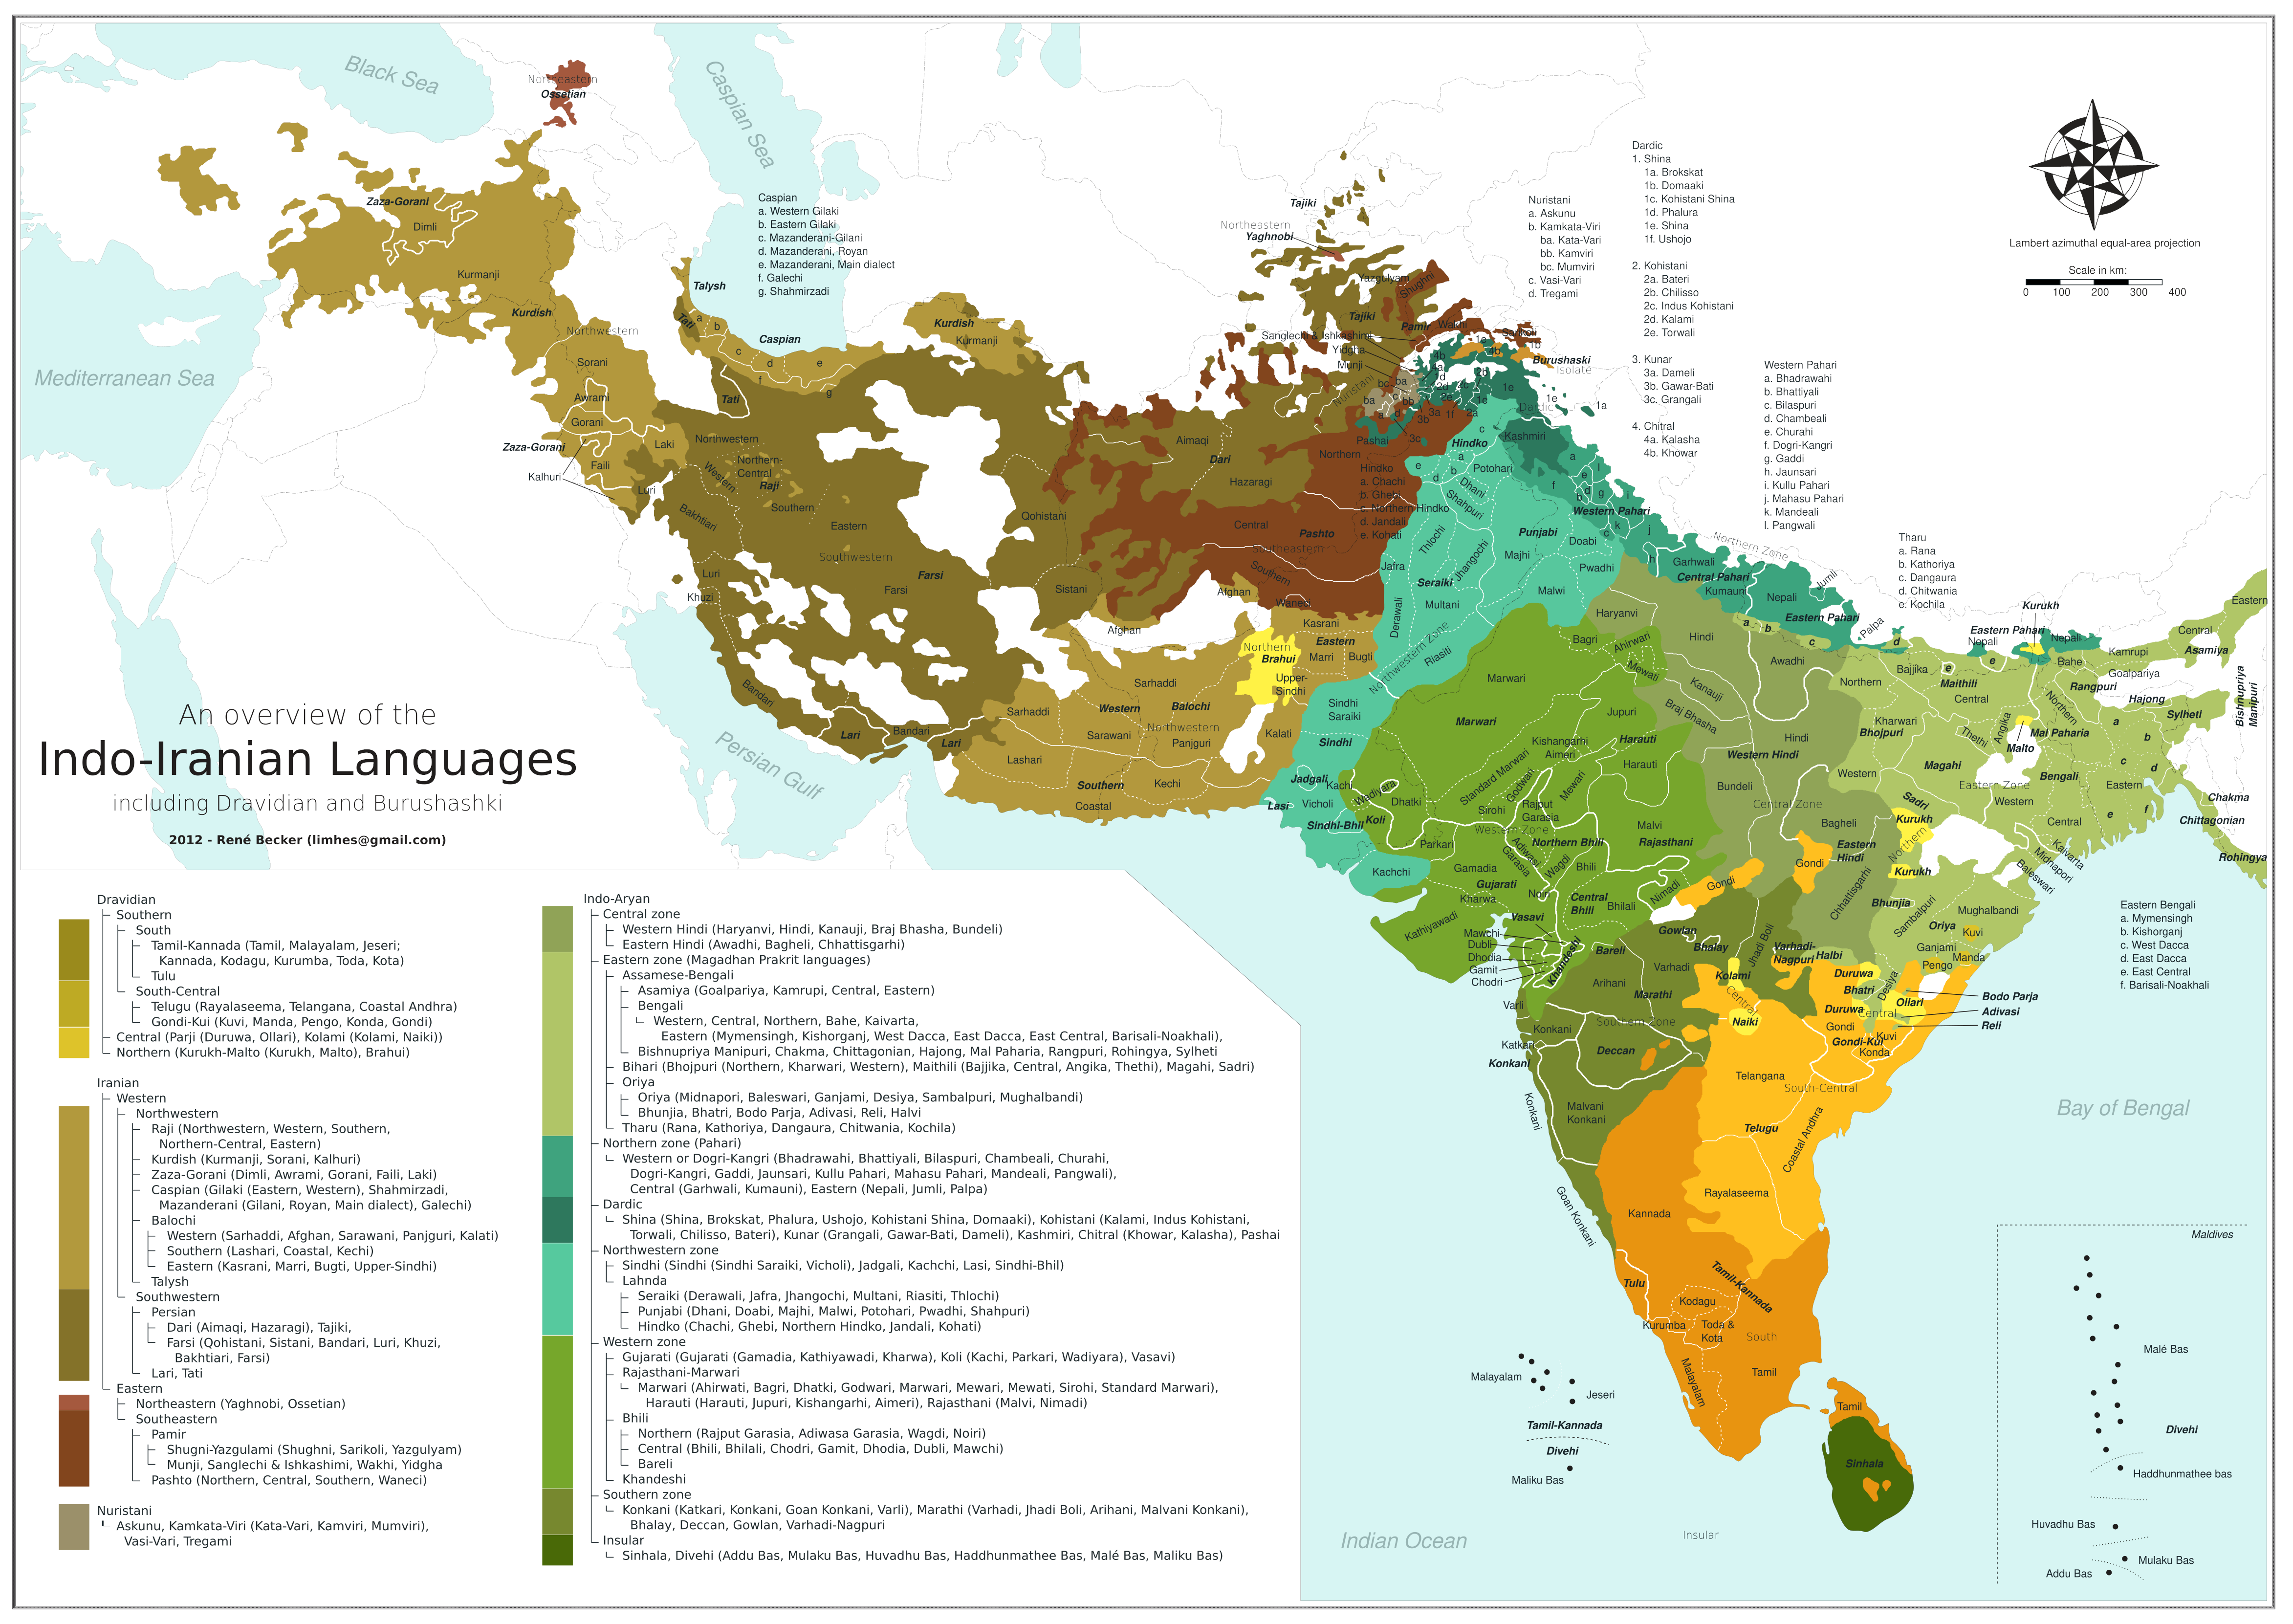
The second and last map in made in this way was a map of the Indo-Iranian languages. This way, the Indo-European languages had all been mapped out and that seemed like a nice accomplishment. I had learned from previous mistakes, and started from an existing vector map. I also made better use of some Inkscape functionalities that saved a lot of time. This was also the first and only map I ever "published", albeit on Reddit. Comments were generally really nice and people liked the looks of it. But, since the map included the Kurdish language, the discussion turned policital and that was a good indication for me that I rather keep this stuff to myself. Luckily you cannot comment on this page :).
GIS language maps
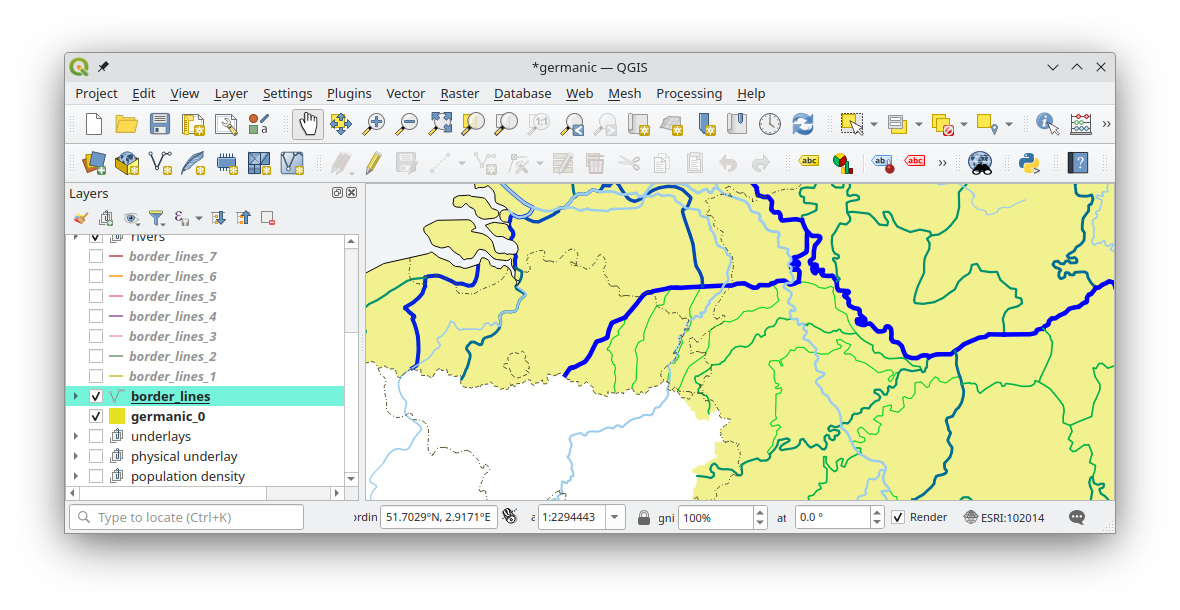
After that last map I started working towards a full global map, with the idea that it would allow me to either zoom in and make exports to create smaller maps, but also to potentially create a fully interactive online map where the user can zoom in/out and (de)select certain language families. To minimize the work I needed to put into it, I started looking into GIS, since that seemed to be the best technology for the job. I learned the basics of QGIS, since it is open source and runs on Linux. I learned how to automate it with Python, but also what a huge PITA that is. Interfacing between QGIS and Python is so extremely clunky and error prone, that I quickly gave up on it. Still, I had some nice ideas: combining population density maps (freely downloadable data with high spatial resolution) with dialect maps, to avoid having to draw "loose" borders in sparsely inhabited regions - Scandinavia and Switzerland are good examples in Europe of where this would be ideal.
Summarizing, if I'd ever continue working on this (humongous) effort, I will surely use GIS in some form. It is so extremely versatile and it has all the required functionalities.
Why I (temporarily?) stopped mapping languages
Apart from the obvious of not having time (raising young kids while both working a full time job), the real reason is more fundamental: Over the years I started understanding that drawing "hard" borders between dialects and languages, is too subjective to be useful. I mean, it serves an illustrary purpose; a talking point; a way to indicate roughly what is spoken where. But the borders... they are often just too diffuse. Most dialect areas are continuums; they don't have hard borders which when you cross them, you suddenly enter a region where a completely different dialect is spoken. Reality is, in many cases, much more subtle: dialect borders group together dialectal variations that, based on certain features, kinda belong together. But if you look at it in a different way, you can draw completely different maps. This is the main objection I have found against drawing these maps: their actual information content.
A second reason would be, that the language situations differ so vastly between regions/countries, that it is almost impossible to capture this in a simple map. Take the Netherlands: in some regions, "true" old-school dialects/regional languages are still spoken (Limburg, the Sakson area, maybe Sealand) but in most regions there is only some minor variation in accent and vocabulary. In those old-school dialect areas, there are variations between age groups etc. Then there are sociolects that defy dialect borders. Linguists can probably list many more reasons why a "dialect map" or a language map is so difficult, or even impossible to make. People might change their language based on social settings. And what not. Arggghhh. Enough reasons for me to temporarily stop mapping dialects, until I find a way to make something useful or well defined with it.
And even if it turns out that it is just for illustration, then that might be okay as well.
"I hope you've enjoyed reading it." - René Becker - June 2023 - Zaandijk, the Netherlands